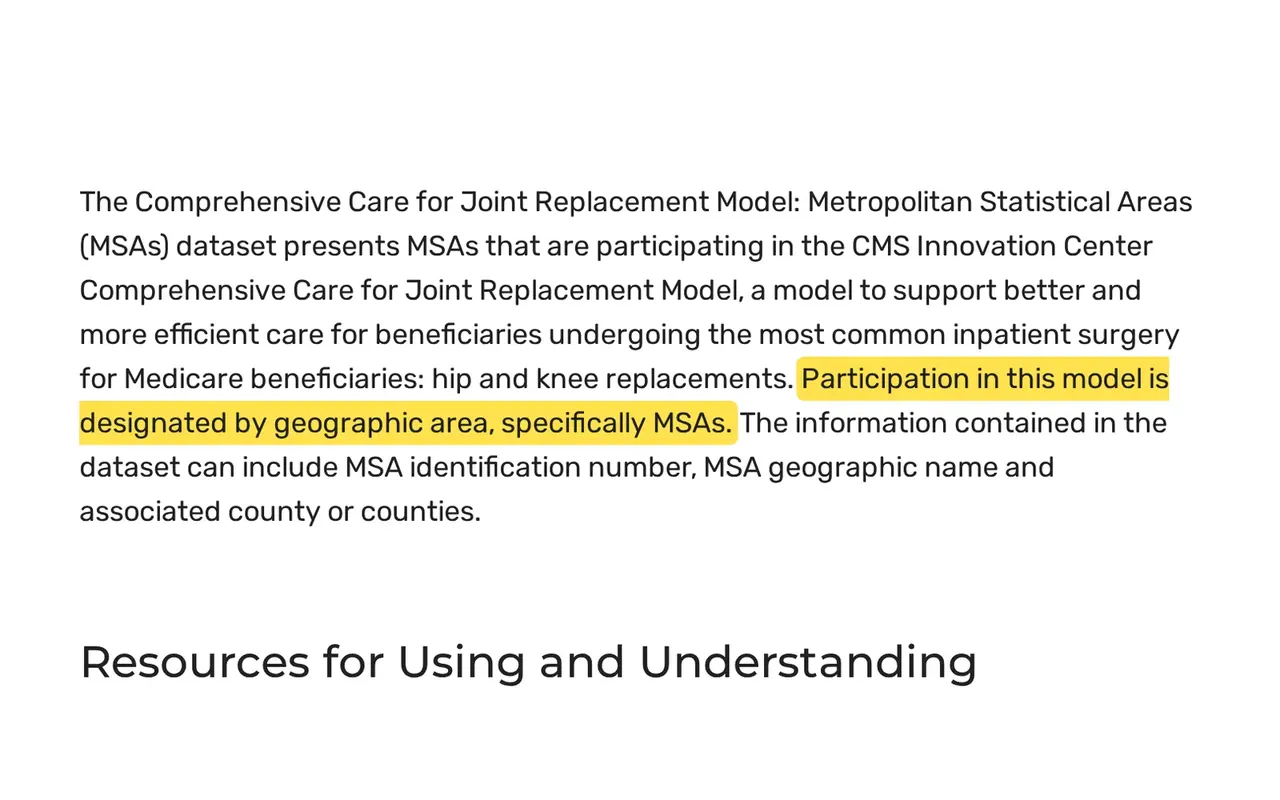
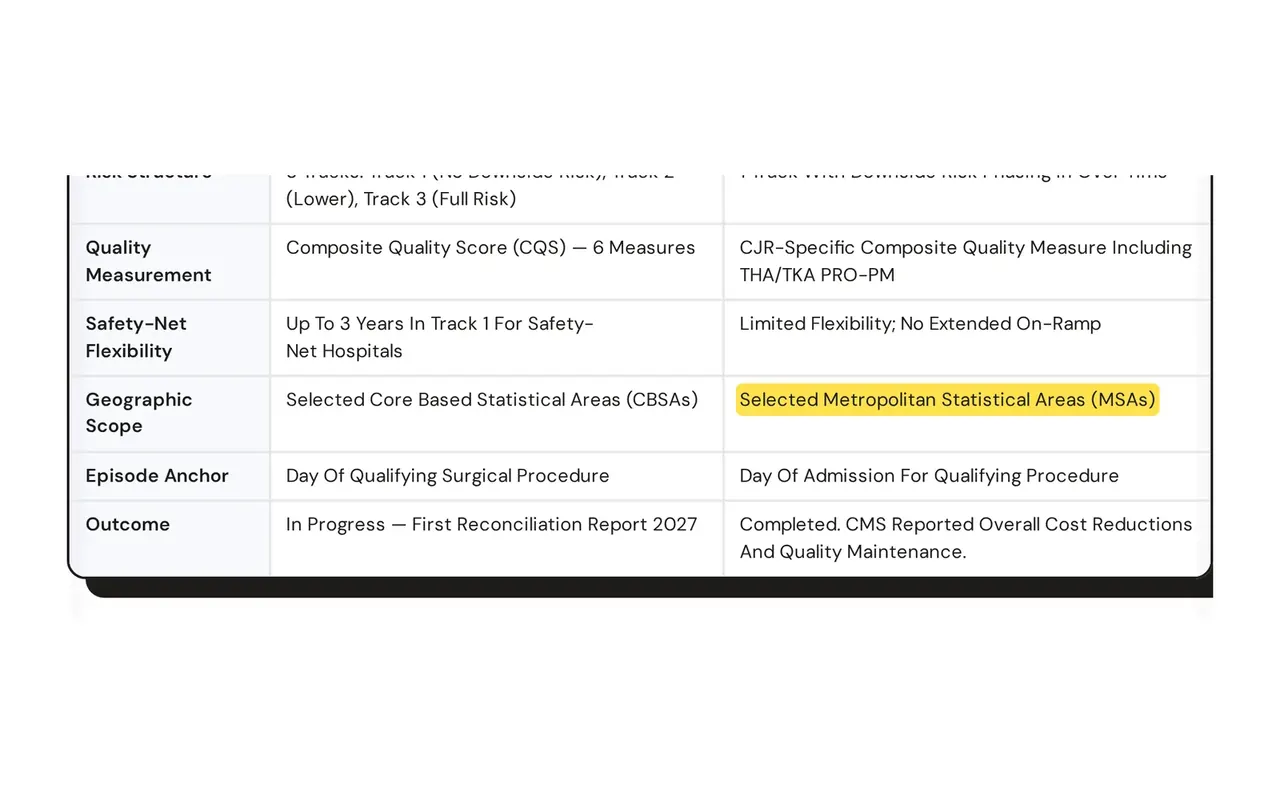
← Back to SourcesS24CJR metro areas · CMS.govMetropolitan statistical areas in the CJR modelChecked November 9, 2026A CMS dataset listing the Metropolitan Statistical Areas that took part in the CJR Model. Each record can include the MSA number, the MSA name and the counties it covers.In the source, Dataset description.‹›1 of 2Open original sourceWhat we say, and what the source saysWhat we sayComparison table, CJR column, Geographic Scope rowSelected Metropolitan Statistical Areas (MSAs)TEAM vs CJRWhat the source saysParticipation in this model is designated by geographic area, specifically MSAs.Dataset descriptionOur table lists CJR's geographic scope as selected MSAs. The CMS dataset says CJR participation is designated by MSA.