
CMS TEAM guide
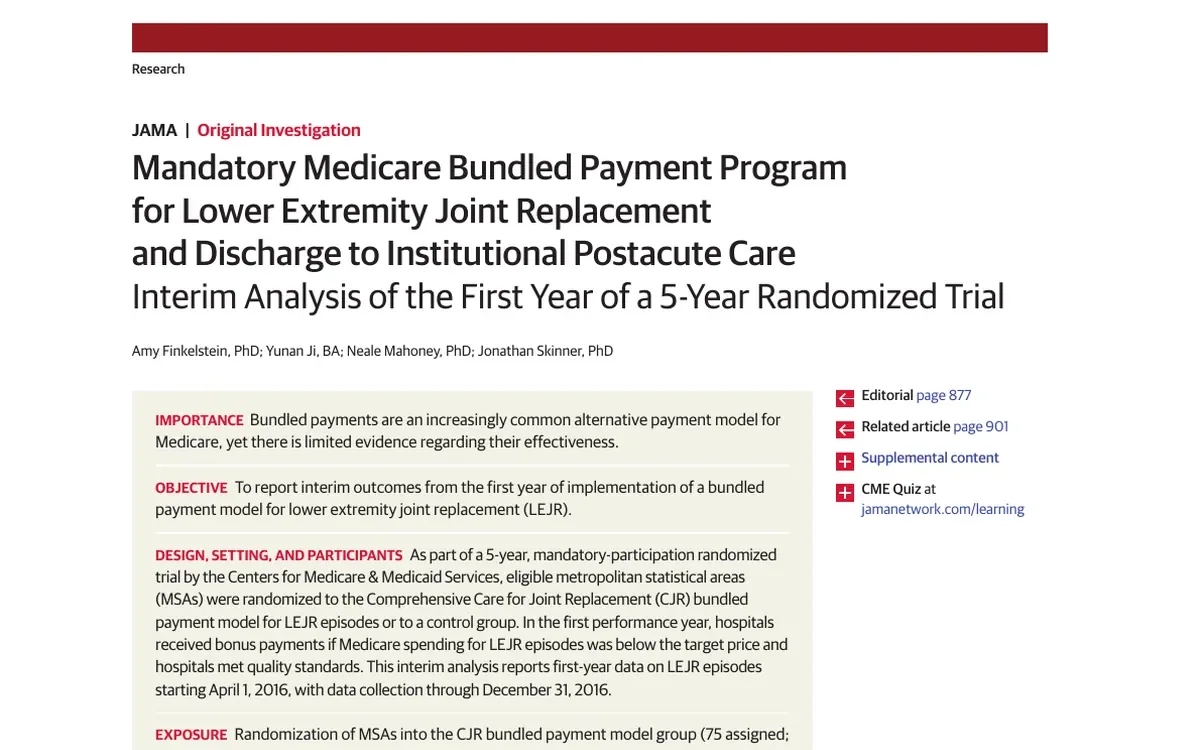
S2
JAMA study · Finkelstein et al., 2018
Checked November 3, 2026
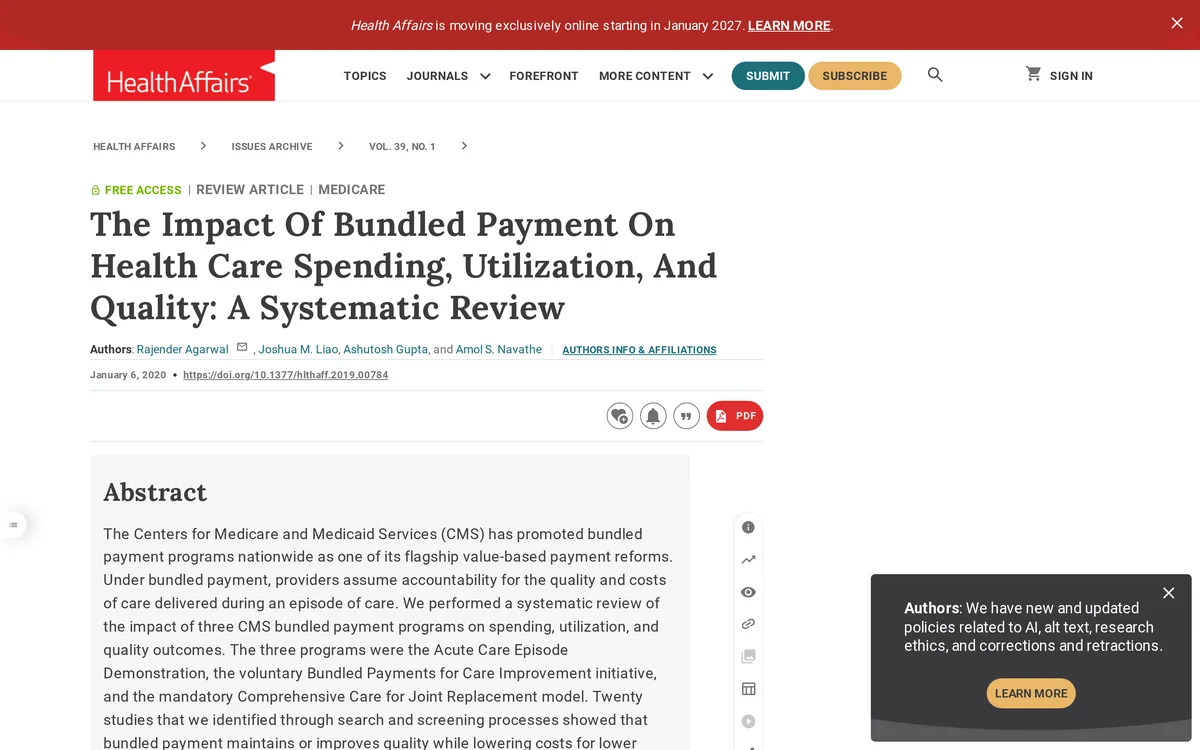
S3
Health Affairs review · Agarwal et al., 2020
Checked November 3, 2026
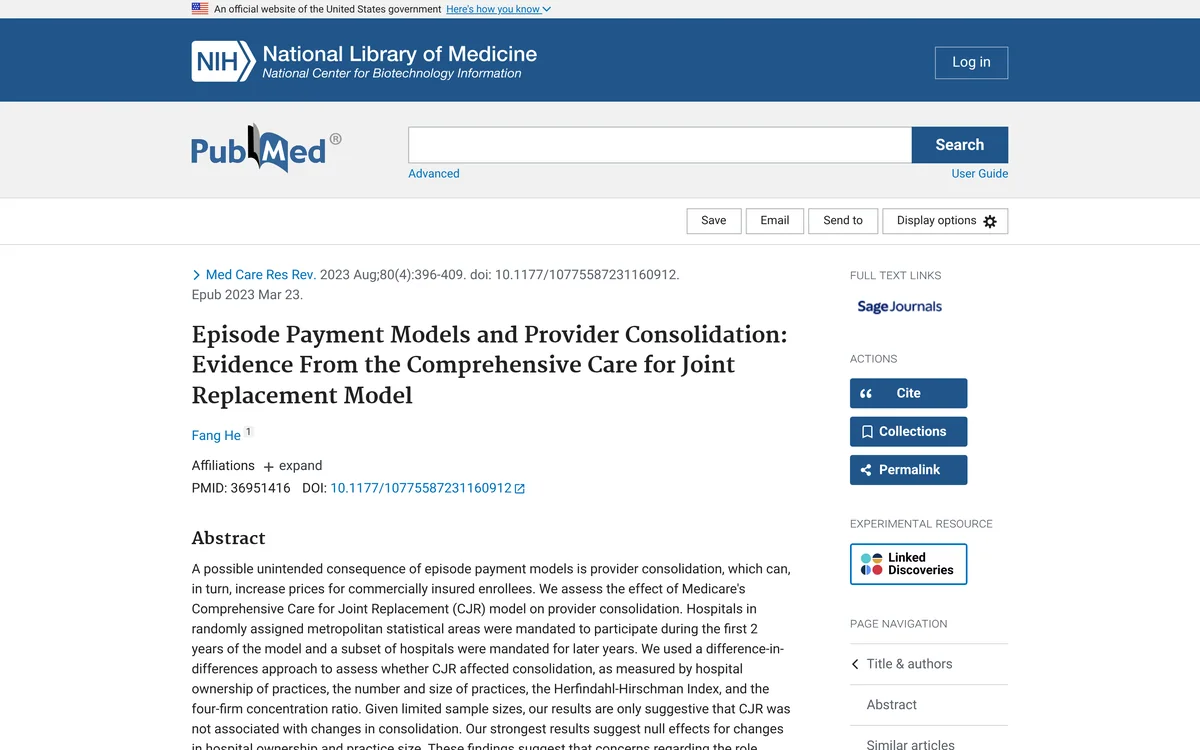
S4
Medical Care Research · He et al., 2023
Checked November 3, 2026
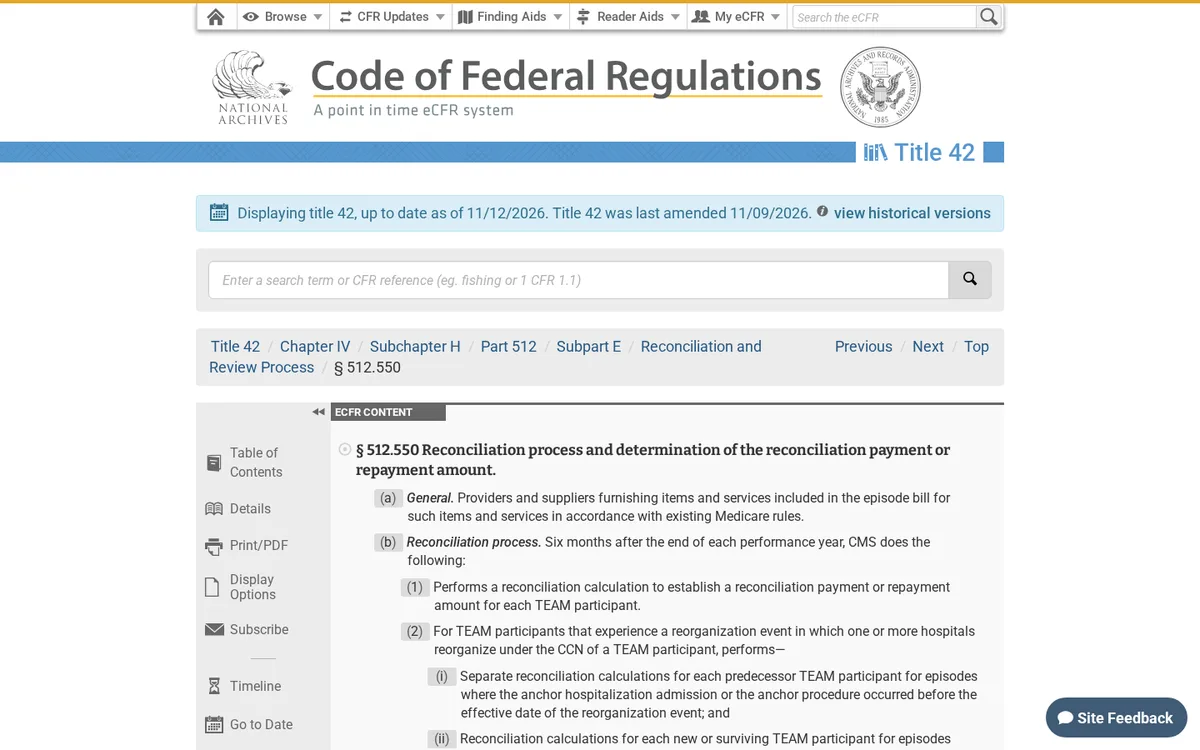
S5
eCFR · 42 CFR § 512.550
Checked November 9, 2026
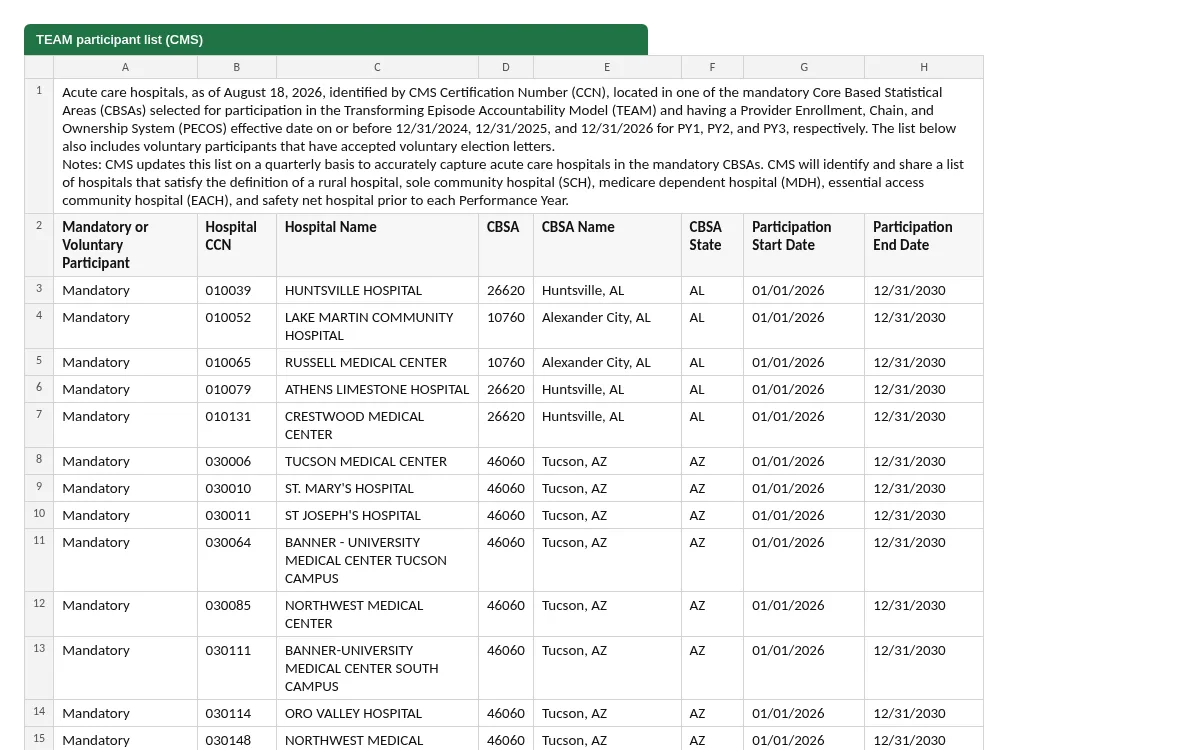
S8
CMS TEAM hospital list · CMS.gov
Checked November 9, 2026
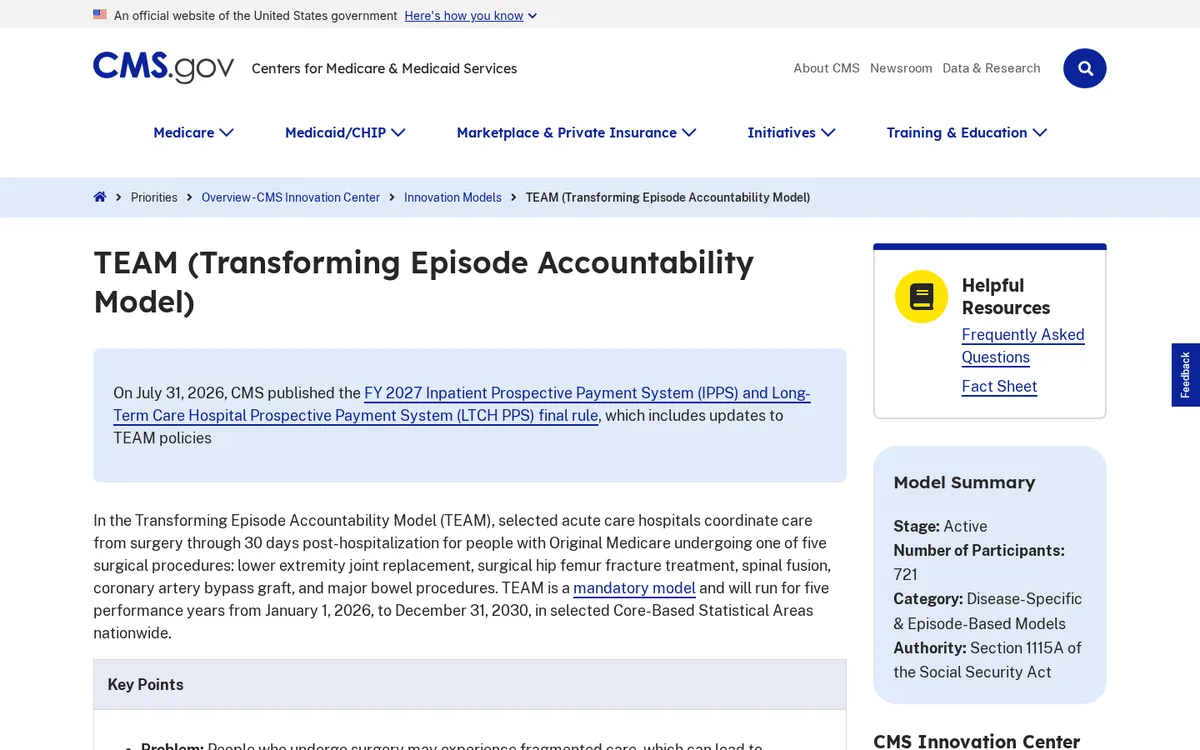
S10
TEAM model overview · CMS.gov
Checked November 9, 2026
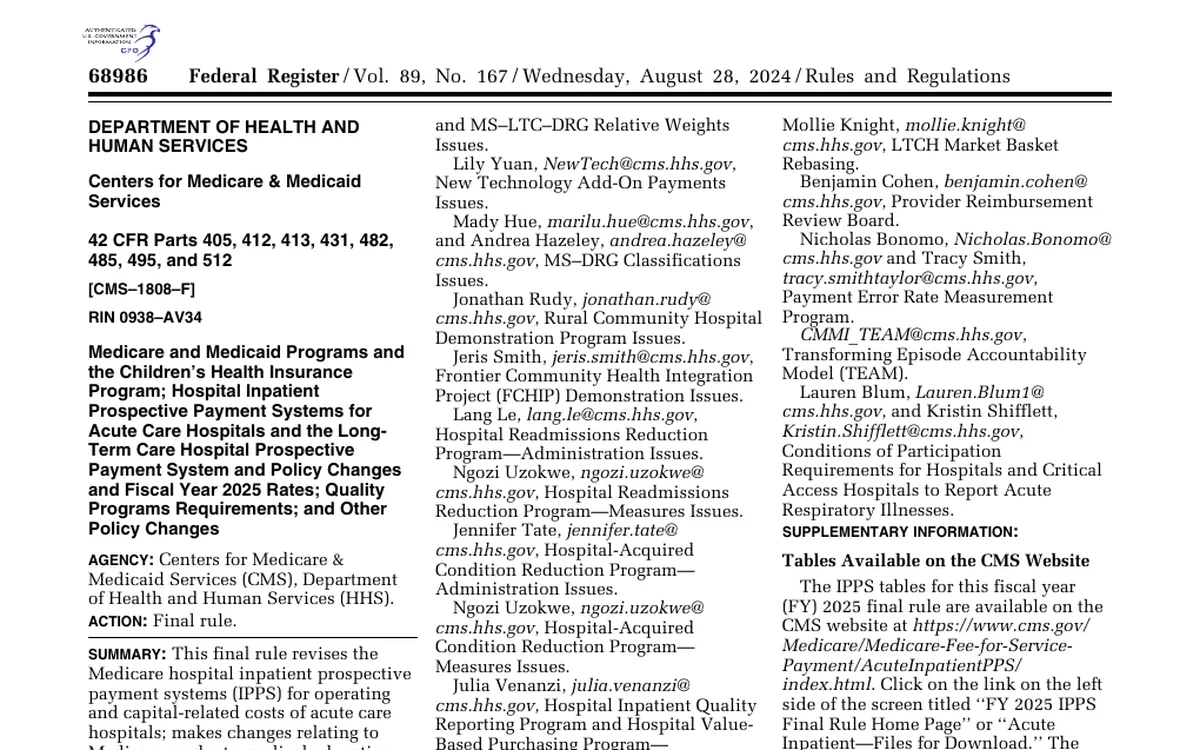
S11
Federal Register · FY 2025 final rule
Checked November 9, 2026
S12
eCFR · 42 CFR Part 512
Checked November 9, 2026
S13
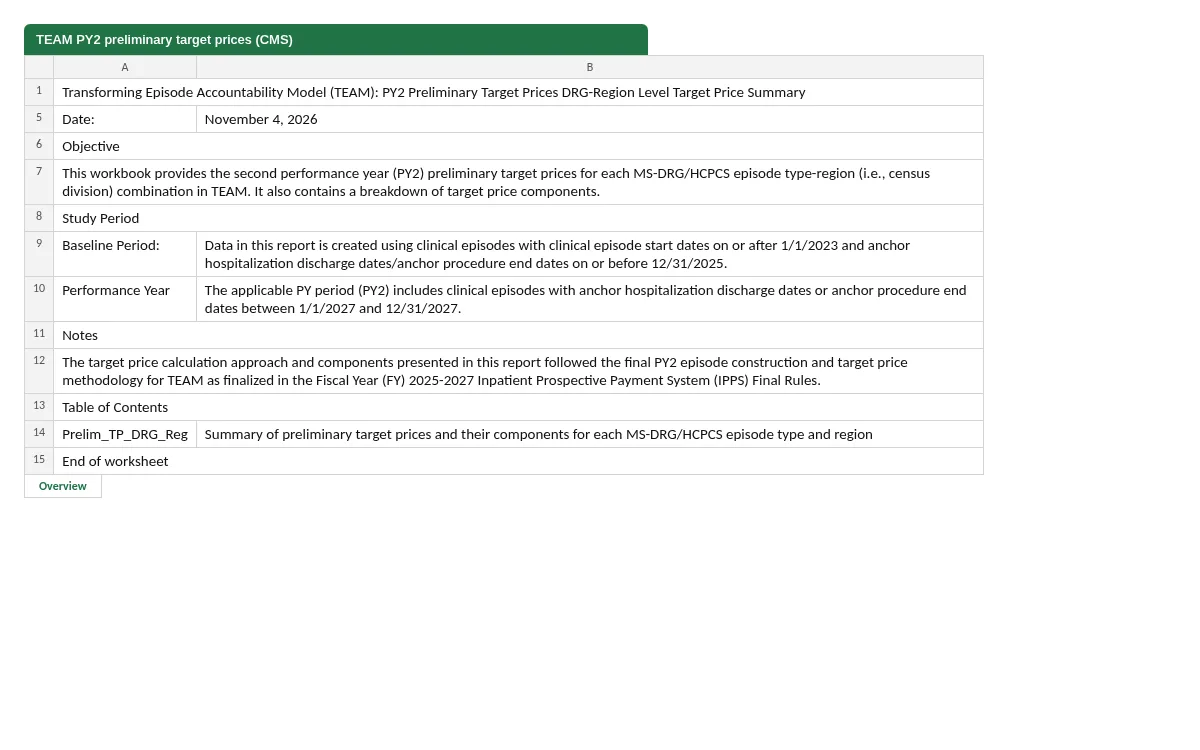
TEAM PY2 target prices · CMS.gov
Checked November 9, 2026
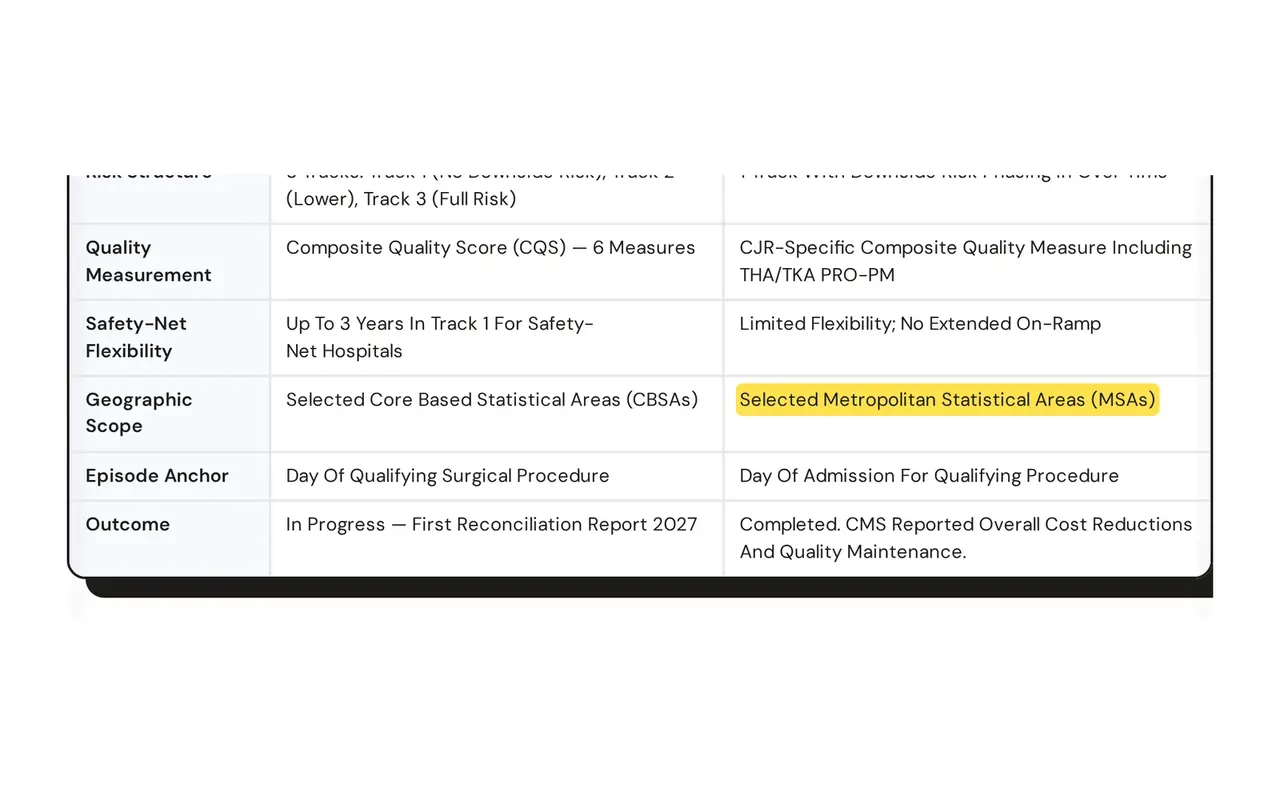
TEAM vs CJR
CJR-X guide
State and region pages
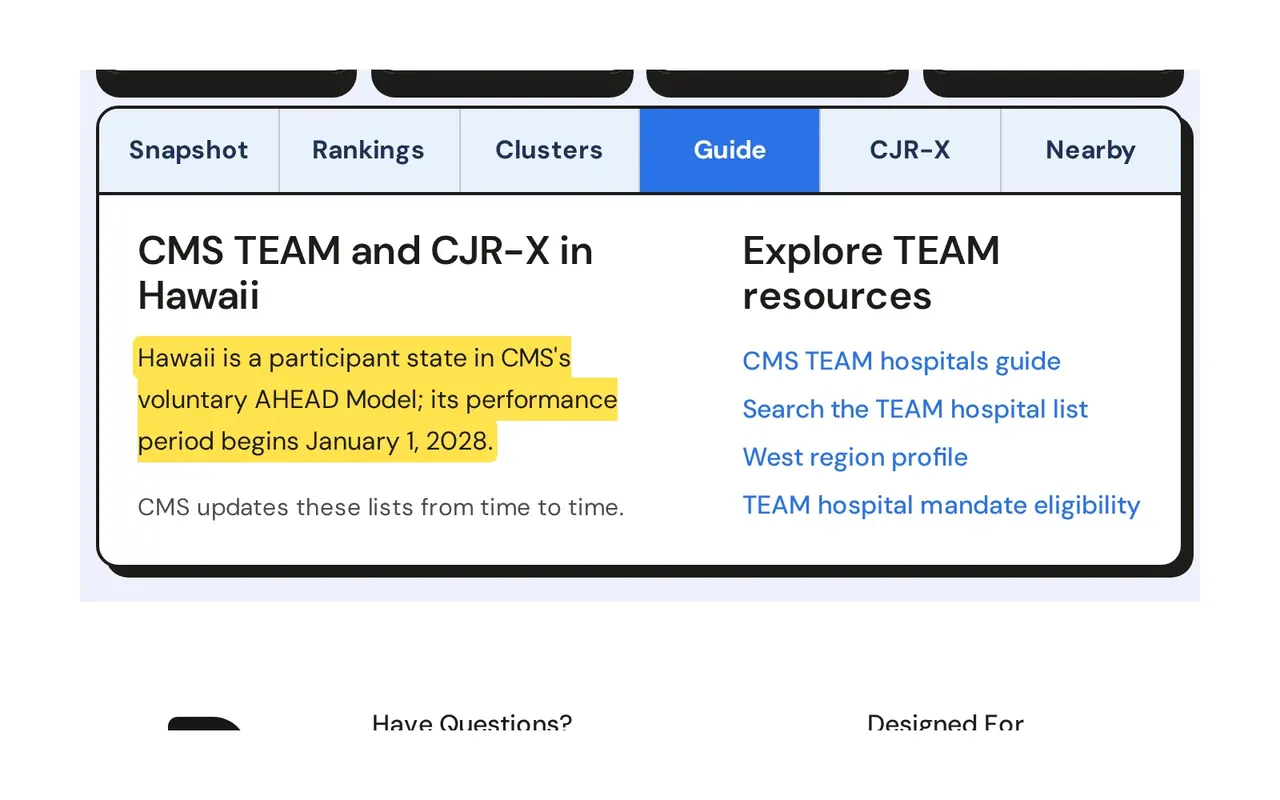
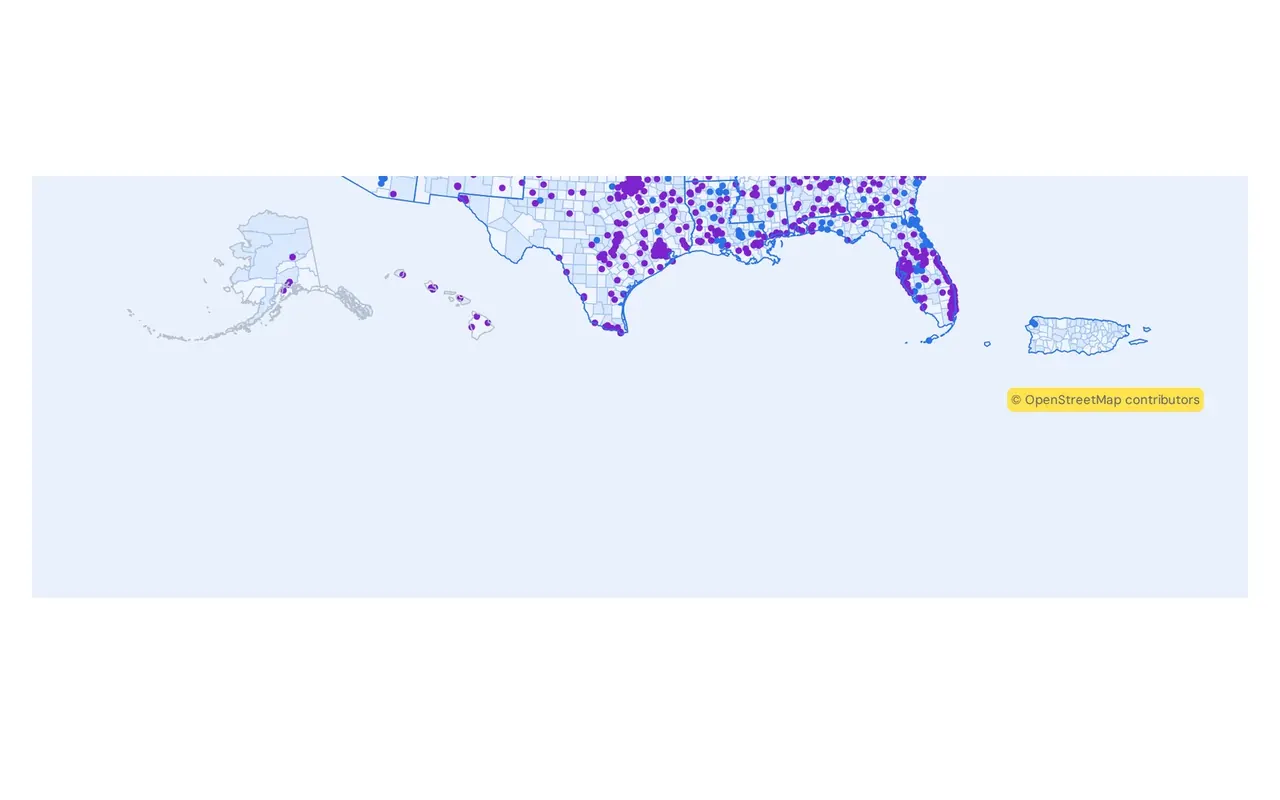
Hospital maps
Charts
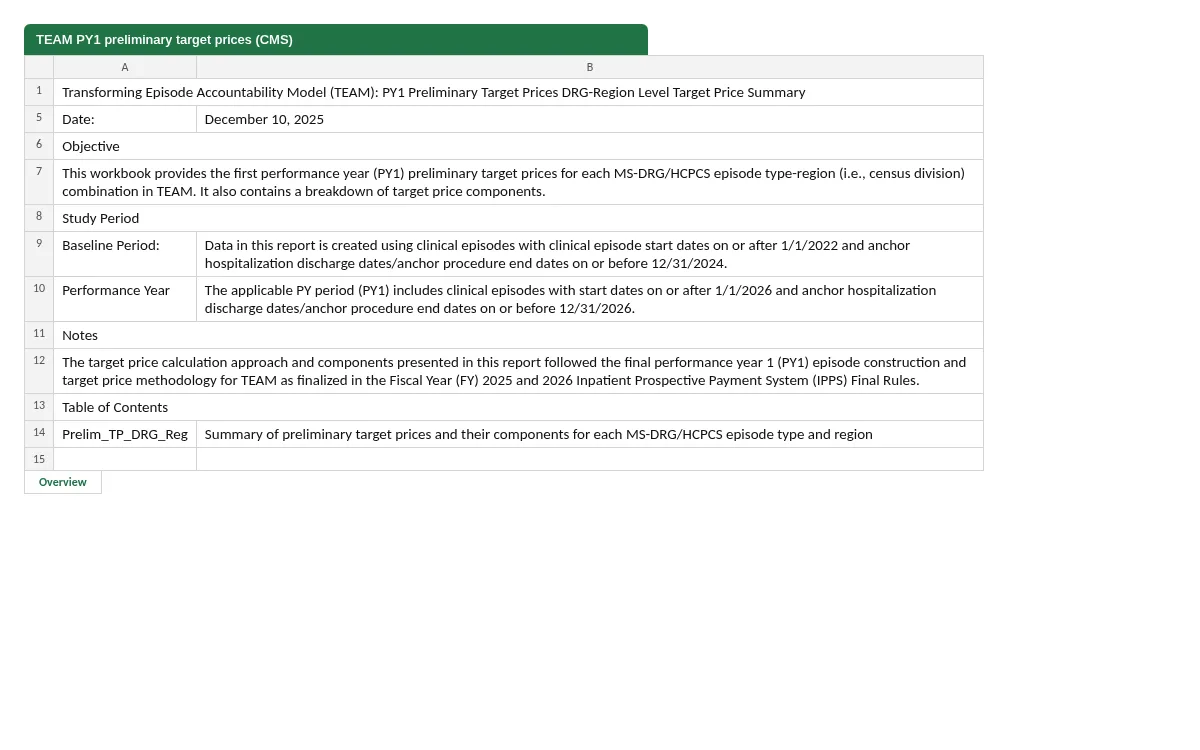
S14
TEAM PY1 target prices · CMS.gov
Checked November 9, 2026
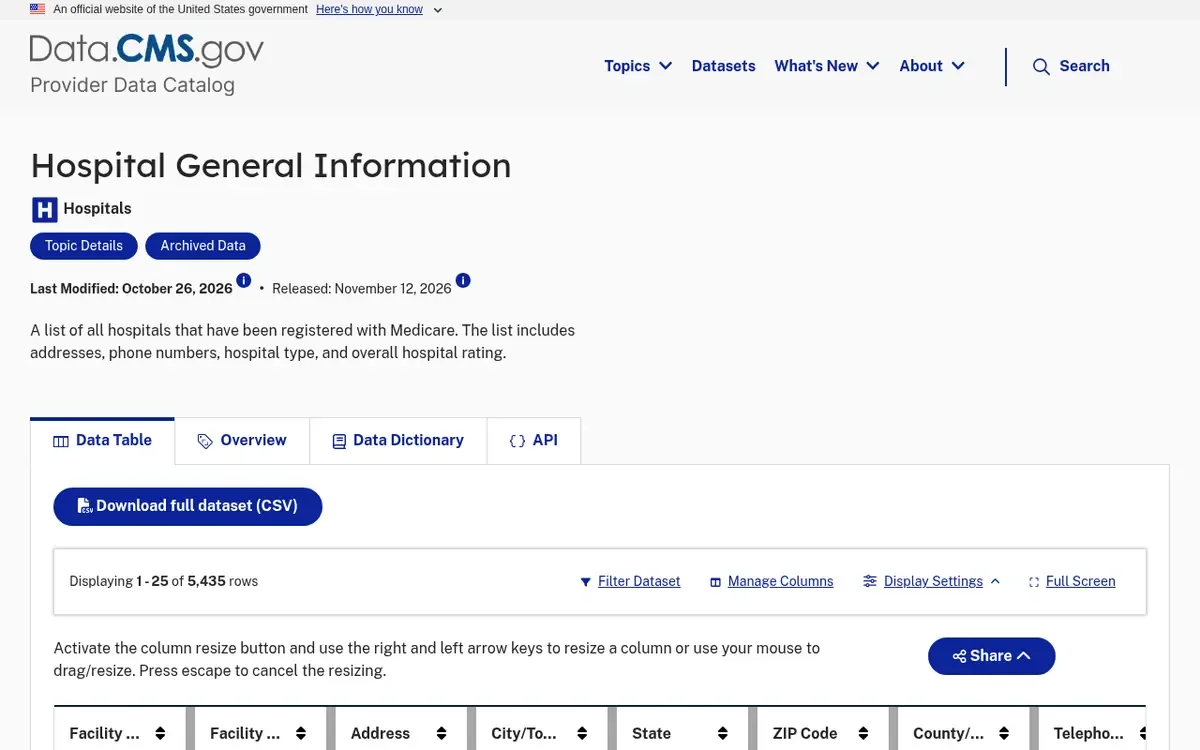
S15
Care Compare · CMS.gov
Checked November 9, 2026
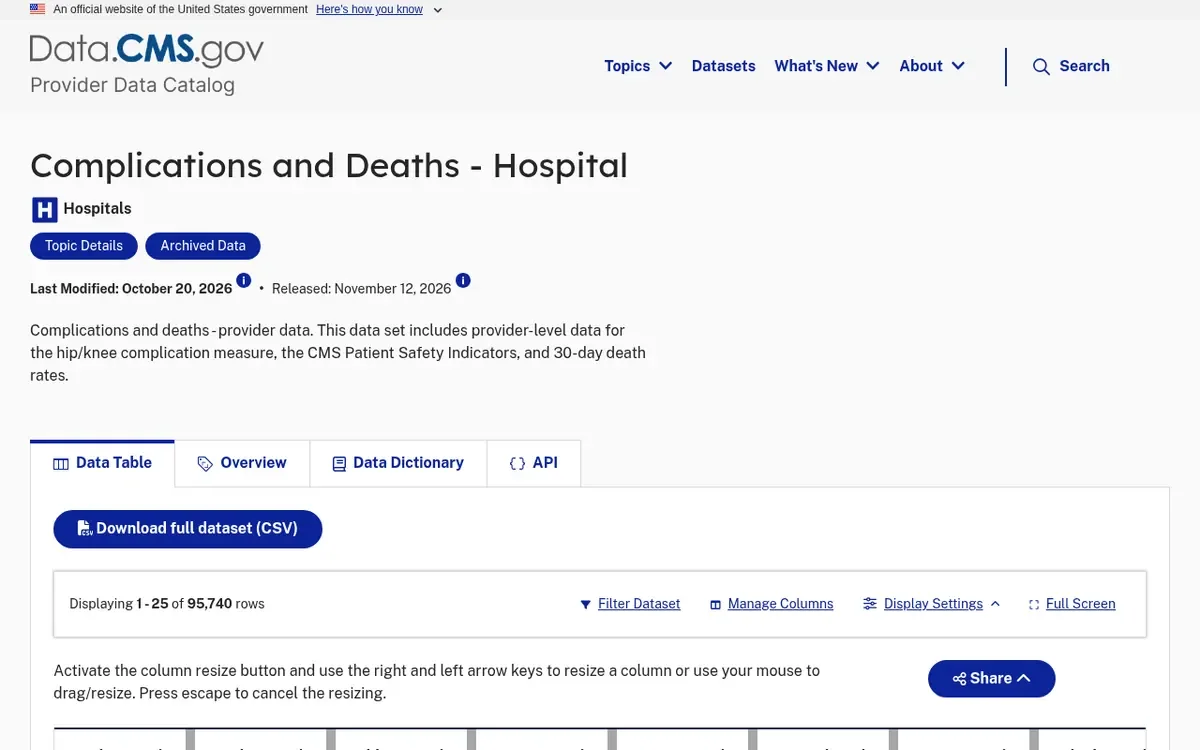
S16
Care Compare · CMS.gov
Checked November 9, 2026
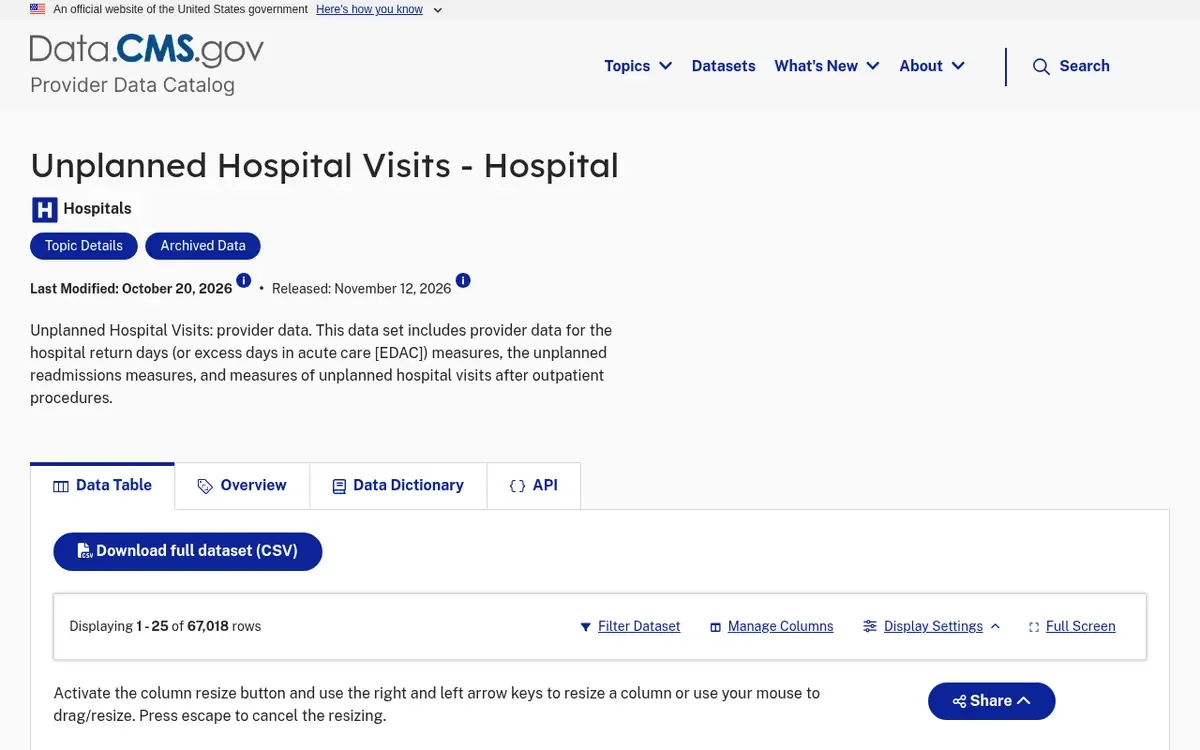
S17
Care Compare · CMS.gov
Checked November 9, 2026
S18
Hospital Readmissions Reduction Program · CMS.gov
Checked November 9, 2026
S19
Provider of Services file · CMS.gov
Checked November 9, 2026
S20
Medicare inpatient claims · CMS.gov
Checked November 9, 2026
S21
Medicare inpatient claims · CMS.gov
Checked November 9, 2026
S22
Medicare outpatient claims · CMS.gov
Checked November 9, 2026
S25
Census Bureau · CBSA delineation
Checked November 9, 2026
Research
E1
NEJM study · Barnett et al., 2019
Checked November 3, 2026

E2
CMS evaluation · CJR year 5
Checked November 3, 2026
E3
CMS evaluation · BPCI Advanced
Checked November 3, 2026
E4
JAMA Network Open · Kim et al., 2019
Checked November 3, 2026
E5
PubMed study · Carey et al., 2023
Checked November 3, 2026
E6
BMC Health Services Research · Kim et al., 2024
Checked November 3, 2026
E7
PubMed study · Ko et al., 2023
Checked November 3, 2026
E8
GAO report · GAO-19-156
Checked November 3, 2026
E9
MedPAC comment · FY 2027 IPPS
Checked November 3, 2026
E10
MedPAC comment · FY 2025 IPPS
Checked November 3, 2026
E11
MedPAC report · June 2022
Checked November 3, 2026
E12
MedPAC comment · CJR extension, 2020
Checked November 3, 2026
E13
CBO report · CMMI budget effects
Checked November 3, 2026
E14
HHS OIG · SNF adverse events
Checked November 3, 2026
How we count
Methods, in short
Hospital counts
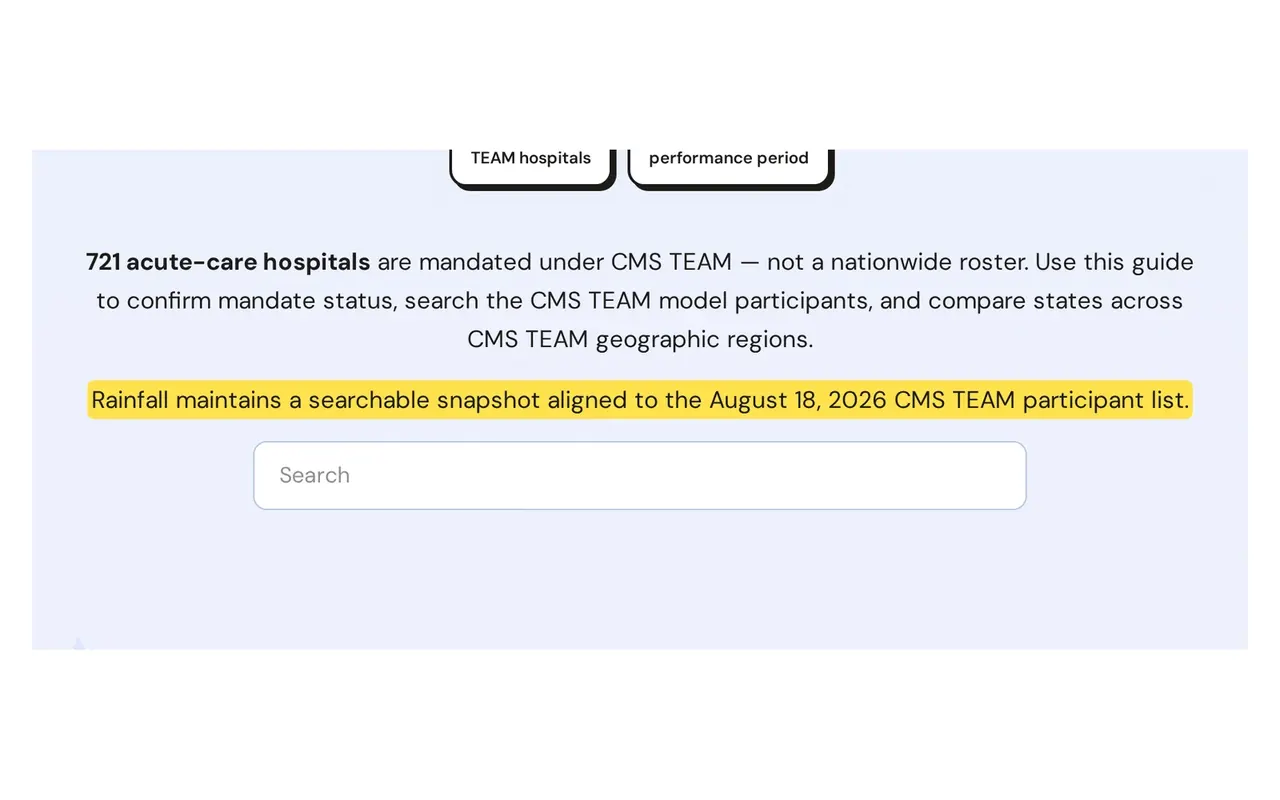
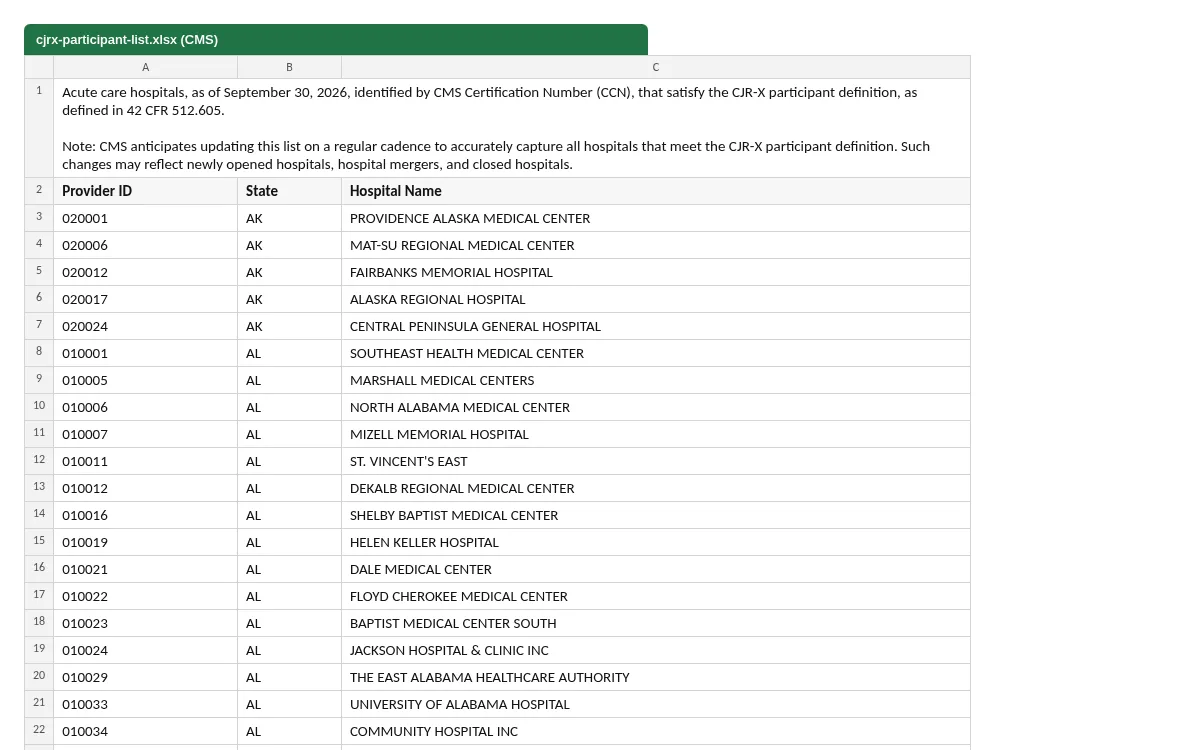
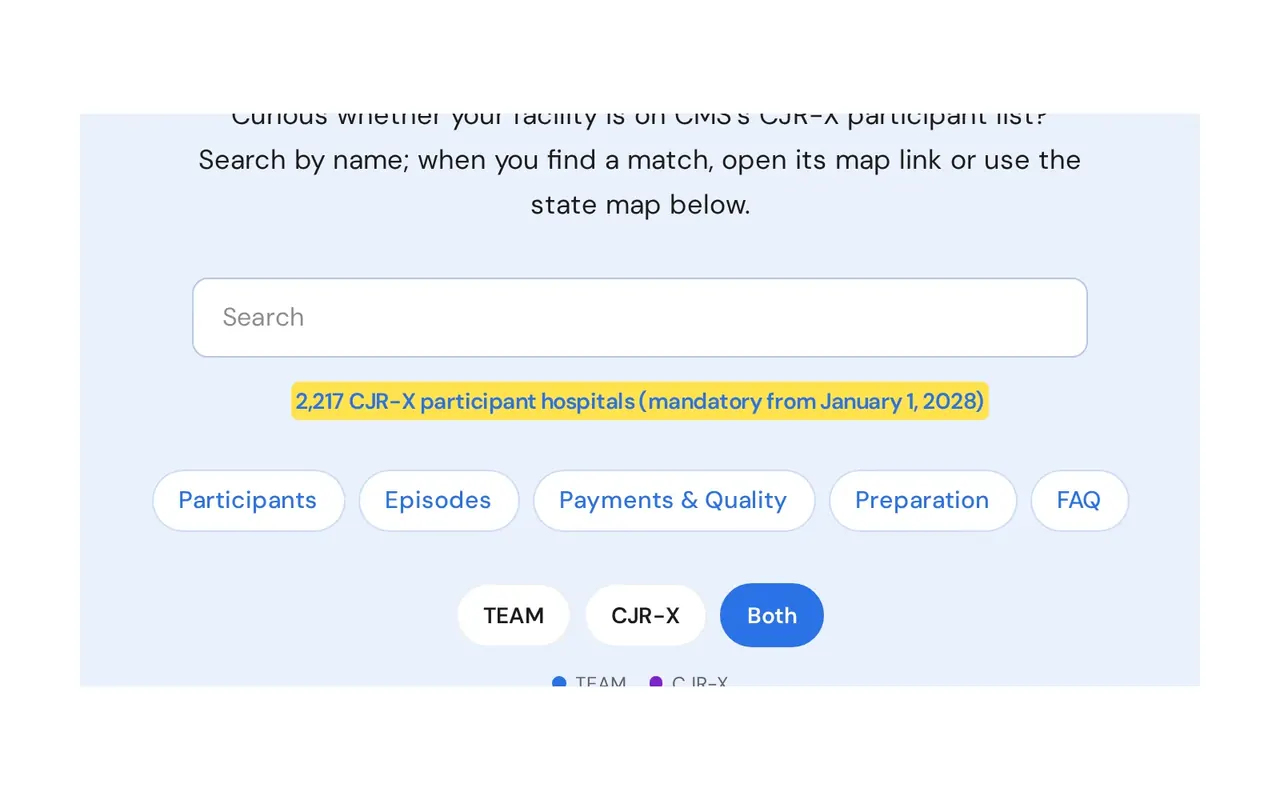
Straight from CMS lists. TEAM: 721 hospitals as of August 18, 2026 (711 mandatory, 10 voluntary). CJR-X: 2,217 hospitals as of September 30, 2026.
Ranks
States with the same count share a rank, shown as “tied”.
Regions
U.S. Census regions. Puerto Rico is shown with the South for navigation only; Census regions exclude it.
Map dots
Approximate, city-level spots from Census and OpenStreetMap geocoding. Hospitals we could not place are counted but not drawn.
Market charts
CMS quality and claims data, grouped by state or region. Groups under 11 hospitals are hidden or pooled. Rates are rounded to one decimal. No hospital names.
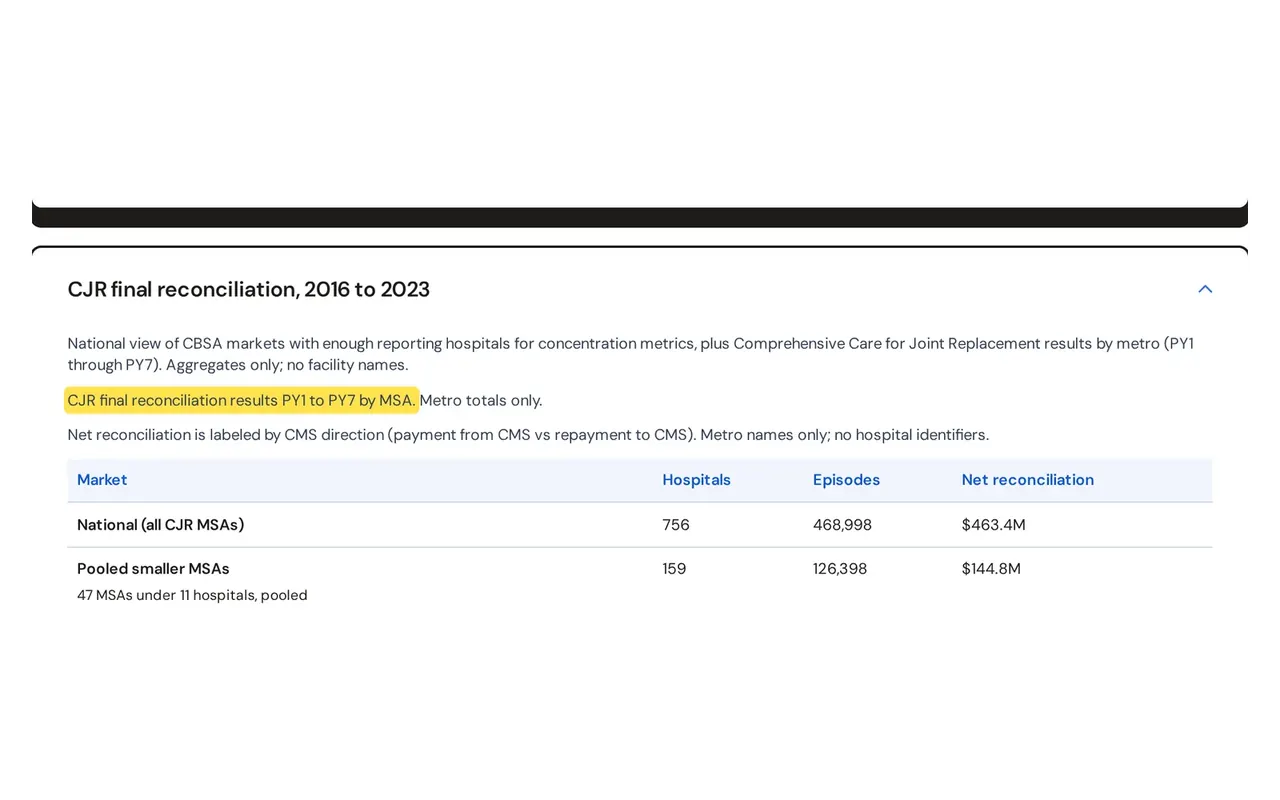
CJR results
Positive amounts were paid to hospitals; negative amounts were repaid to CMS. We read the sign from 2016, a year with no repayment risk, where the lowest amount is $0.
Metro markets
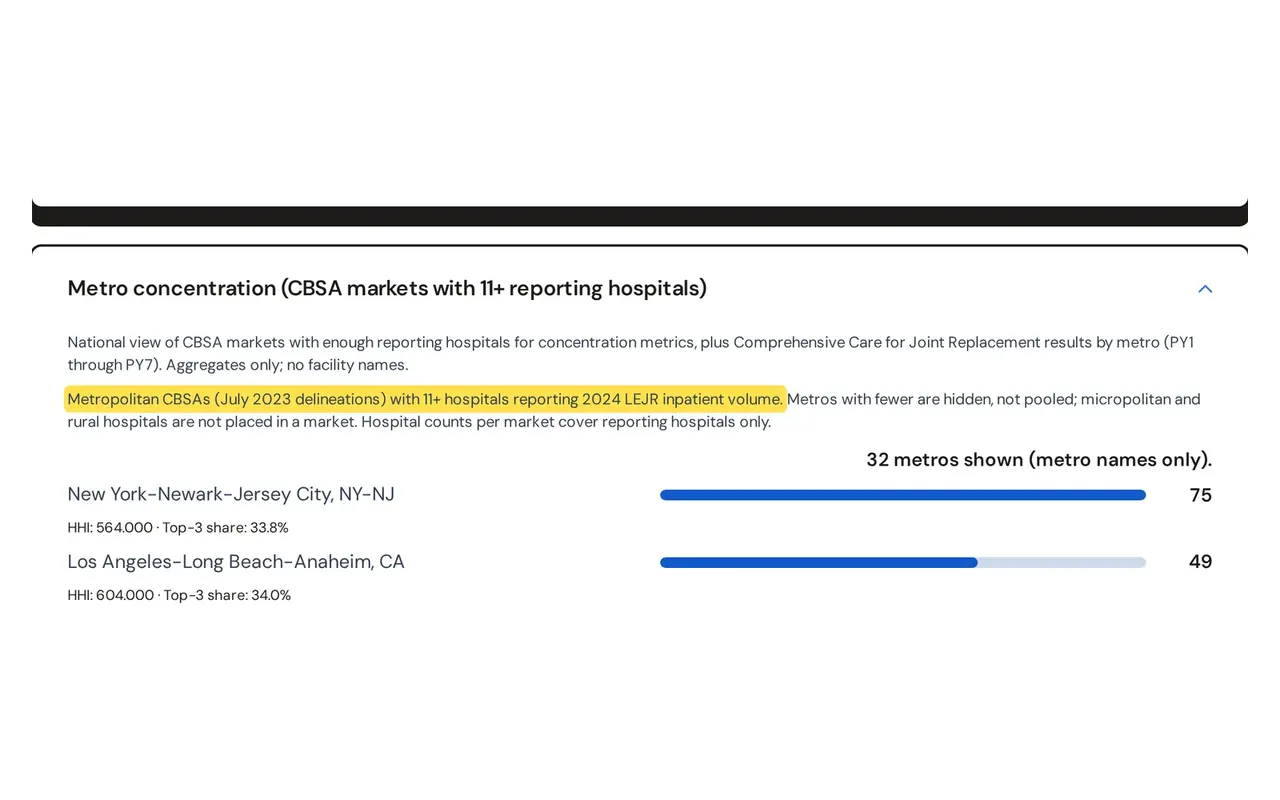
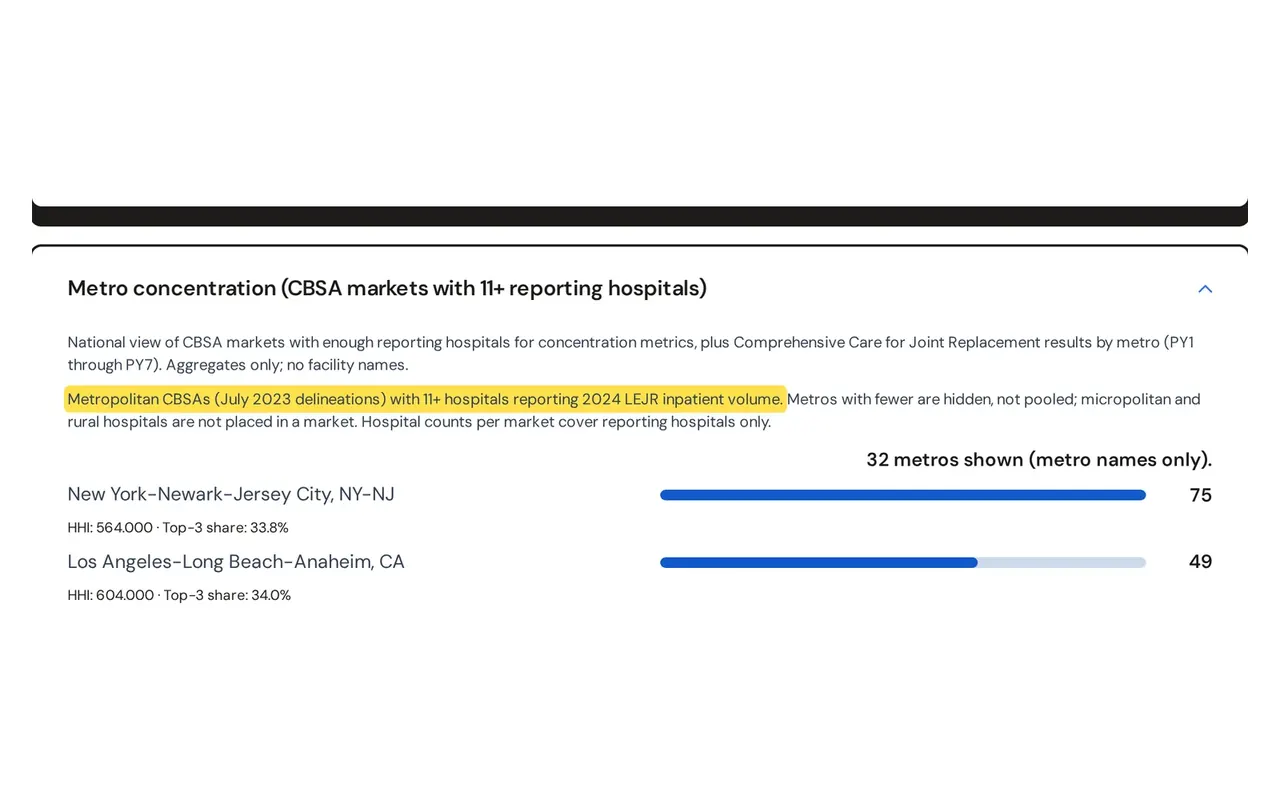
Hospitals are placed in July 2023 metro areas by county. Outpatient counts treat one billed service as one procedure.
Last reviewed
- CMS TEAM guideNovember 9, 2026
- TEAM hospital pages, states and regionsNovember 9, 2026
- CJR-X guideNovember 9, 2026